
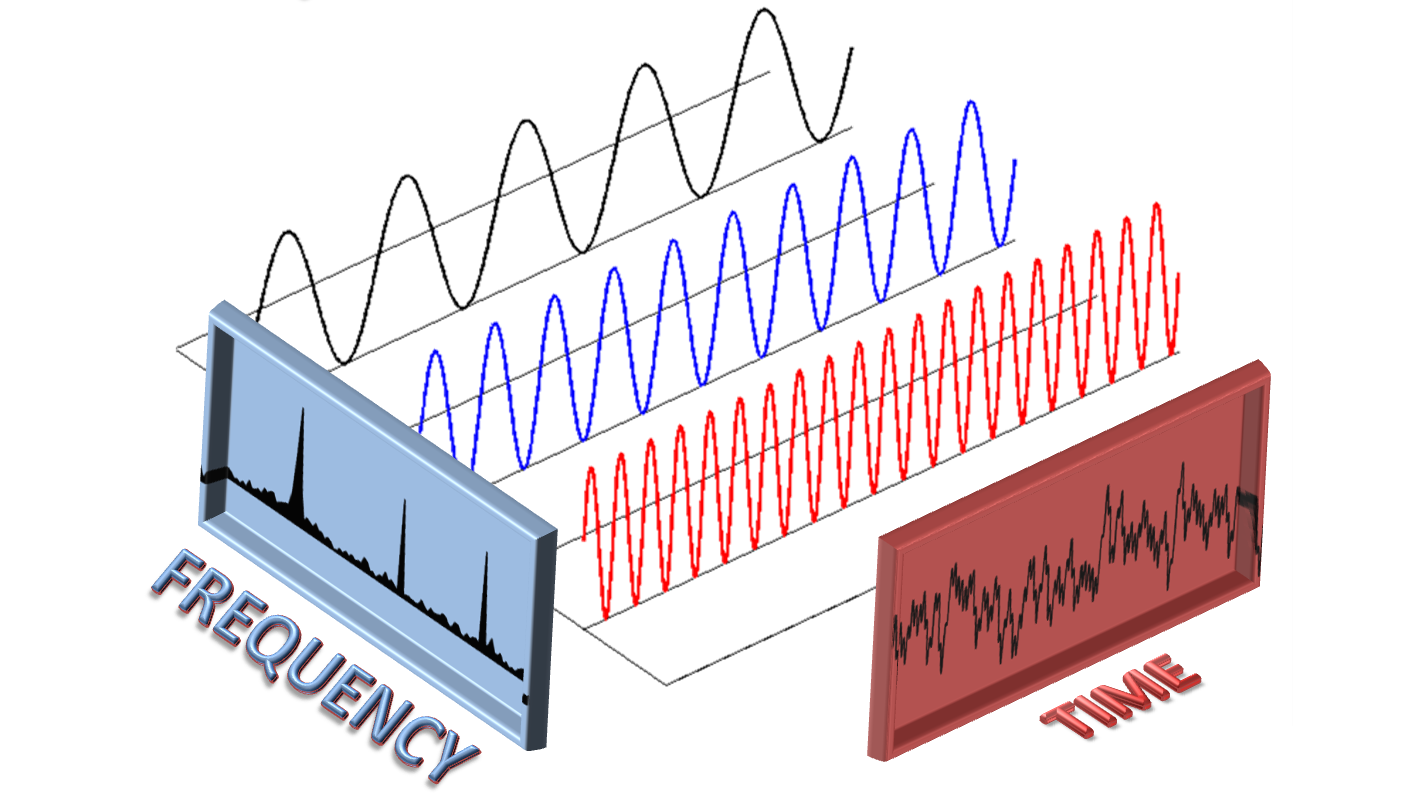

|||| Now each color of light has a distinct frequency, isnt it?
|||| Now, lets say we want to arrange these colors in increasing order of their frequencies.
|||| It will look like this.,......below.

|||| Now lets see what we did around here,

|||| Now, lets take just one of them,...hmmmm.. RED for example.

|||| x(t) is the waveform which is a function of time.
|||| When this waveform i.e x(t) is rotated in a horizontal plane......
YES....
e^j(angle)---------> Rotation in the anticlockwise direction in a horizontal plane.
e^-j(angle)---------> Rotation in the clockwise direction in a horizontal plane.
(By the way....e^i(angle) --------> Rotation in the vertical plane.)
|||| Now e^ j(2.pie.freq.time) = cos(2.pie.freq.time) + j.sin(2.pie.freq.time)
Where....cos(2.pie.freq.time) = Horizontal component of the waveform.
and... sin(2.pie.freq.time) = Vertical component of the waveform.
|||| Now lets say you want to plot the entire vibgyor on the frequency spectrum. So now for that you will have to keep on adding all the amplitudes of all the different colors onto the frequency spectrum graph.
|||| Integration is another term for adding.
|||| So,... Integration of (e^(2.pie.freq.time)) = adding all the amplitudes of all of colors (from Red to violet) one after the other(This is synonymus to plotting them on a graph one after the other).
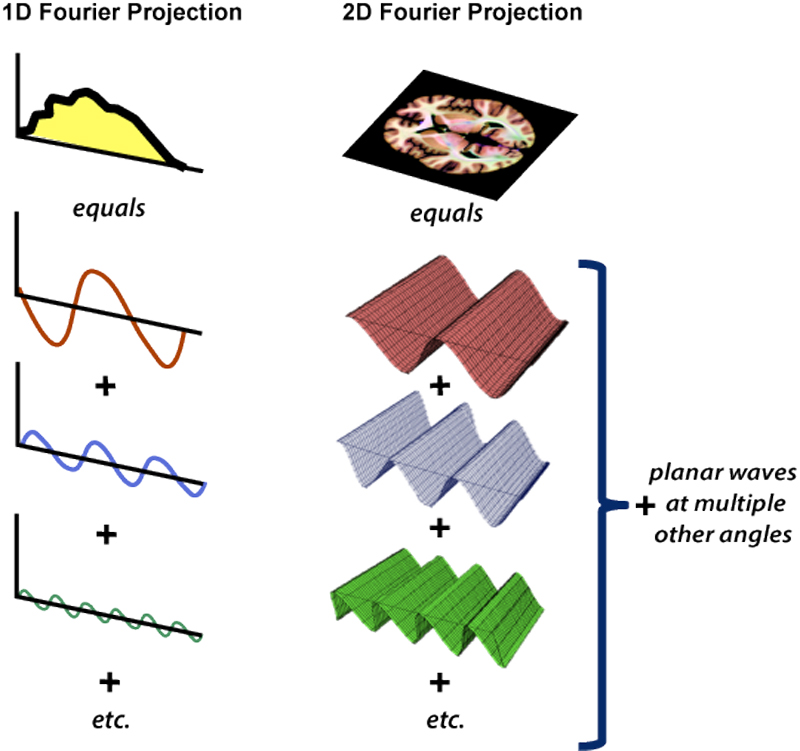
|||| So basically if there was an algorithm for fourier transforms....it would be as follows.....


Another way of putting it .......

ALTERNATE USEFUL EXPLANATION THROUGH WIKIPEDIA IMAGE
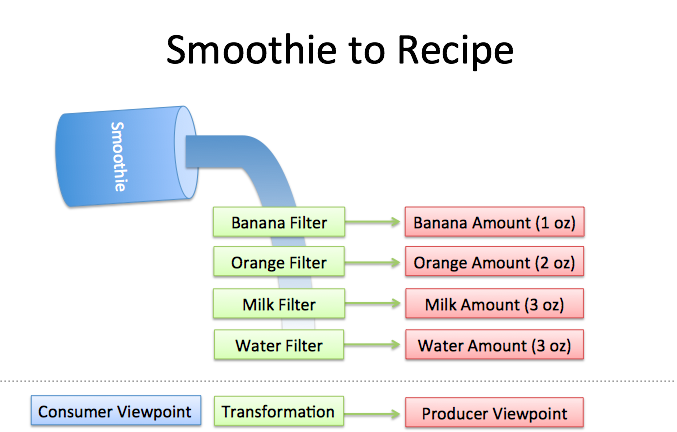
NOW WHAT IS THE APPLICATION OF FOURIER TRANSFORMS???????
|||| Truth being told, I myself dont know it fully.
|||| The below image from wikipedia is the best explanation I could get.
TO FULLY UNDERSTAND WHY MATHEMATICIANS USE FOURIER TRANSFORM, YOU MAY HAVE TO CONSIDER TRYING TO UNDERSTAND WHY MATHEMATICIANS OF THE MEDIEVAL PERIOD USED THE LOG TABLE LIKE A CALCI TO MULTIPLY TWO OR MORE MAMMOTH NUMBERS

- Mathematicians of the medieval era used to use the Log table like a calculator for multiplying two big numbers.
- They used to exploit the fact that LOG(AXB) = LOG(A)+ LOG(B).
- Thus multiplication on the L.H.S becomes addition on the R.H.S in the world of Logarithms.
- So this is how it used to work for them. LOG(1st BIG NUMBER X 2nd BIG NUMBER) = LOG (1st BIG NUMBER) + LOG(2nd BIG NUMBER) So lets take an example.
- Lets say its the medieval period and Galileo (the telescope fella) wants to multiply 47000 x 6500.
- Galileo has a Log table with him. So this is what he does.
- He takes Log(47000) from the Log table and notes it down as 4.67209.
- Then he takes Log(6500) from the Log table and notes it down as 3.8129
- Then he adds both these numbers 4.67209 + 3.8129 = 8.48499
- Now Galileo takes the antilog table and calculates antilog(8.4899) and gets 3054850772 = approximately 3055000000....the real product of multiplying 47000 x 6500.
- (And about this antilog thing...i always wondered what it was....turns out just as the natural log ln is the evil twin brother of e^x .....our Log to the base 10 has got an evil twin as antilog which is nothing but 10^x).
- (Also notice how mammoth sized numbers like 47000 and 6500 got reduced to puny numbers like 4.67209 and 3.8129....far more manageble and guess what you dont have to even multiply these puny numbers,...you just got to add them and them after getting the sum...look into the antilog table for the corresponding antilog.)
- Thus the log table acted like a slightly cumbersome but viable calculator for the medievial mathematicians.
- Just as the mathematicians of the medievial age who entered converted numbers into their corresponding logarithmic values,....to make calculations easier,...and then after the calculations were performed,...took the antilog and left, modern mathematicians use the fourier transform as a tool to simplify calculations, and after the calculations are done,....they let go off the tool by taking the inverse fourier transform, and thus coming back to the time domain.

SOME USEFUL LINKS
BUY

AVAILABLE FOR PURCHASE FOR 5$ (INR 300) HERE (PDF)

ABOUT

Then one day....a miracle happened,....while applying a certain formula again and again.....I came to know its significance. Slowly and steadily....other equations also started clicking. I got to see a strong relationship between Maths and the Physics it was pointing towards. They both were the same. Maths was just an easy language to express a physical phenomenon. And a bit more to that in the sense that it could even predict the behaviour of a certain physical phenomenon. Equations now as if came to life.
Every equation now had as if something to say. A burning urge to share these things with the world aflamed within me. So that no one has to give up the subject that he or she loves the most.
Every equation now had as if something to say. A burning urge to share these things with the world aflamed within me. So that no one has to give up the subject that he or she loves the most.
The book on visualizing maths thus got written as a sprout of inspiration. The blog followed. Both these are dedicated to you and all such similar minds searching for answers.
Visualizing Math & Physics is a blog dedicated to you and all such similar minds searching for answers.
CONTACT
binnoypanicker@gmail.com


FROM BETTER-EXPLAINED.COM
No comments:
Post a Comment